General Tab
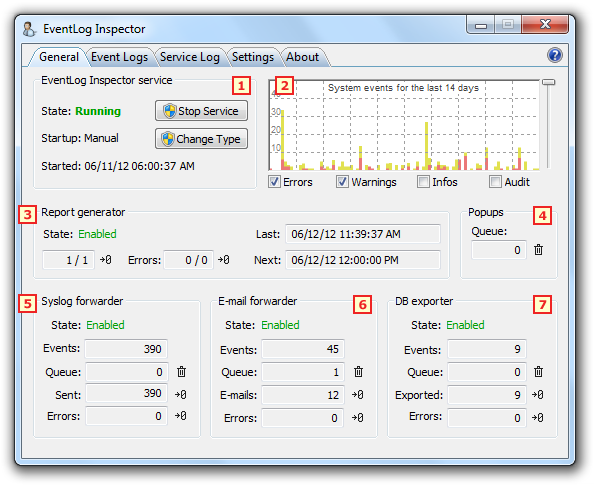
The General Tab lets you manage the EventLog Inspector service and displays status and statistical information.

-
EventLog Inspector Service
Service information and service management. -
System Events Graph
System events for some period of time in graphical representation. -
Report Generator Status
Information on reports generation. -
Popup Queue Indicator
The number of popup windows in queue to be shown. The queue is formed in case if previous windows are still displayed on the screen and there is no space for the new ones yet. -
Syslog Forwarder Status
Information on fowarding system events to syslog sever. -
Email Forwarder Status
Information on forwarding system events to e-mail box. -
DB Exporter Status
Information on exporting system events to database.
EventLog Inspector Service
- State - current service state.
- Stop/Start Service - allows to stop and start the service.
- Startup - service startup type: Automatic or Manual.
- Change Type - changes the type of service startup from Automatic to Manual and vice versa.
- Started / Last startup - information on the service: launch time in case the server is running at the moment or the last startup status: Failed or Success. In case if the last startup failed Details link is displayed.
- Click Details to display the reason of the last startup failure.
System Events Graph
This section includes a graph showing event statistics. You can adjust the period using the slider on the right, ranging from 30 minutes to 14 days.
Use the checkboxes below to hide or show events based on their type. Each event type is represented by a different color.
Report Generator Status
-
State: Indicates the current status of the report generator, which can be Disabled, Enabled, or Error. If in the Error state, an additional link titled Details will appear. Click on Details to view the error description.
-
Last: The date and time of the most recent report generation.
-
Next: The date and time of the upcoming scheduled report.
-
Reports: A counter showing the number of successfully generated reports, alongside a counter for reports successfully sent via email (if emailing is enabled).
-
Errors: A counter displaying errors that occurred during report generation and emailing. If the error count is above zero, Errors becomes a hyperlink. Clicking it reveals the description of the latest error. For more details on the errors, check the service log.
Syslog Forwarder Status
-
State: Indicates the current status of the syslog forwarder, which can be Disabled, Enabled, or Error. If in Error, a Details link will appear, which you can click to view the error description.
-
Events: A counter showing the number of processed system events.
-
Queue: The number of syslog packets waiting to be sent. The queue forms when events are registered in the system faster than they can be sent to syslog.
-
Sent: A counter for the number of syslog packets sent. This count corresponds to the number of system events forwarded, as each system event is sent in a single syslog message.
-
Errors: A counter showing the number of syslog packets that couldn't be sent due to errors. If the error count is above zero, Errors becomes a hyperlink. Clicking it reveals the description of the latest error. For more details on the errors, refer to the service log.
Email Forwarder Status
-
State: Reflects the current status of the email forwarder, which can be Disabled, Enabled, or Error. If in Error, a Details link appears, which you can click to view the error description.
-
Events: A counter showing the number of system events forwarded via email.
-
Queue: The number of emails waiting to be sent. The queue forms when events are registered in the system faster than they can be sent via email.
-
Emails: A number of successfully sent emails. This value is often lower than the Events count because multiple events can be combined into a single email.
-
Errors: A number of emails that were not sent due to errors. If the error count exceeds zero, Errors becomes a hyperlink. Clicking on this link will display a description of the most recent error. For more detailed information on the errors, consult the service log.
DB Exporter Status
-
State: Shows the current status of the database exporter: Disabled, Enabled, or Error. If it is in Error, a Details link will appear. Click on it to view the error description.
-
Events: A counter showing the number of processed system events.
-
Queue: The number of event records awaiting export. The queue forms when events are registered in the system faster than they can be exported.
-
Exported: A counter showing the number of event records successfully exported.
-
Errors: A counter showing the number of event records not exported due to errors. If the error count is above zero, Errors becomes a hyperlink. Clicking it will show a description of the most recent error. For more details on the errors, refer to the service log.